Understanding Stock Chart Patterns
May 17, 2024 By Triston Martin
In finance, one important ability for investors is understanding stock chart patterns. These patterns give investors a sense of market feeling and help them make good choices while trading. This article will assist you in learning to recognize main stock chart patterns so that your trading strategies can be improved and profits can be increased.
Identifying Trends
The starting point for noticing important stock chart patterns is to properly recognize trends. Trends are classified as going up (bullish), going down (bearish), or moving sideways (neutral). When there is an upward trend, it means that the prices of stocks are increasing over time and if there is a downward trend, this signifies falling prices. Sideways trends indicate that there is no strong movement in price. Traders who notice these trends can predict possible changes in price and take appropriate steps.

Comprehending trends means studying different things that affect how the market changes, like signs of the economy, feelings of investors, and events in geopolitics. Information about the economy, central bank announcements, or political problems can make a big difference to the trends in markets by changing how people feel as investors and also affecting the prices of different assets. Moreover, keeping track of sectoral trends and their connection with wider market indices can give an important understanding of where the market is going.
- Consideration: Keep an eye on global macroeconomic events and geopolitical developments, as they can swiftly alter market trends and investor sentiment.
- Caution: Avoid relying solely on historical trends without considering current market conditions and external factors influencing price movements.
Common Chart Patterns
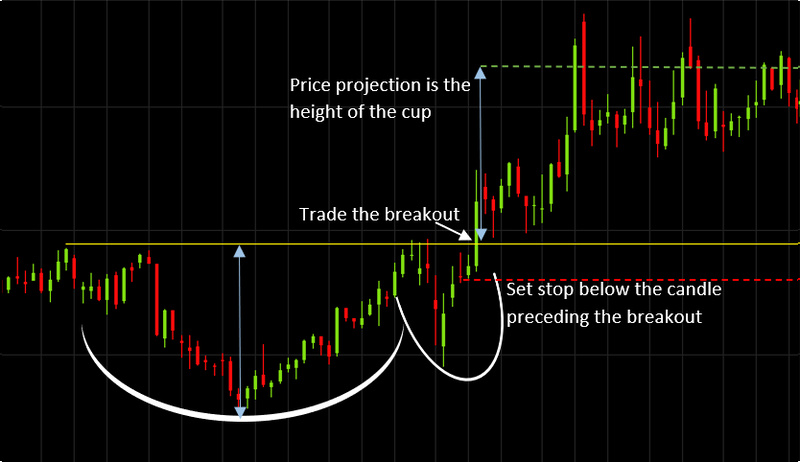
In stock trading, many chart patterns happen often. These forms are created by the movement of prices and they may indicate possible shifts in market direction. Some significant patterns are head and shoulders patterns, double top or bottom patterns, triangles patterns, flags patterns as well as pennants patterns. Understanding the characteristics and implications of each pattern is essential for effective trading strategies.
Even though these patterns give a useful understanding of possible market changes or ongoing movements, it is important to think about the bigger picture in the market and how much volume matters. Patterns shown with high volume are thought to be more dependable signs of breakouts or breakdowns. This implies that a robust purchasing or selling force is supporting the price shift.
- Fact: Certain chart patterns, such as triangles and flags, often indicate periods of consolidation or indecision in the market before a significant breakout or breakdown occurs.
- Noteworthy: Pay attention to the duration and amplitude of chart patterns, as longer-term patterns typically generate more substantial price movements compared to shorter-term formations.
Technical Indicators
Apart from chart patterns, technical indicators are also very important in the study of stock charts. These indicators like moving averages, relative strength index (RSI), and moving average convergence divergence (MACD) give a useful understanding of market trends and momentum. Combining technical indicators with chart pattern analysis can boost trading signal precision and decision-making efficiency.
Every technical indicator brings a distinct viewpoint to comprehend market trends and momentum, helping traders verify signals formed by chart patterns. For example, the fusion of trend-following indicators like moving averages with oscillators such as RSI can aid in confirming the robustness of price trends and finding possible turning points more accurately.
- Consideration: Use multiple technical indicators in conjunction with chart patterns to validate signals and minimize false trading signals.
- Noteworthy: Avoid over-reliance on technical indicators, as excessive analysis may lead to analysis paralysis and missed trading opportunities.
Confirmation and Validation
Apart from recognizing chart patterns, it is also crucial to get confirmation and validation for these patterns before making a trade. Confirmation of a pattern happens when its validity is checked by examining volume trends and different technical indicators. Validation, on the other hand, involves waiting for price movements that confirm the expected direction suggested by the pattern. This careful method decreases the chances of wrong signals and enhances the likelihood of winning trades.
To confirm chart patterns, a common practice is to wait for price confirmation such as breakout or breakdown levels that have increased trading volume. Moreover, aligning multiple technical indicators and observing the behavior of market participants may add more validation for possible trade chances.
- Fact: Confirmation and validation are iterative processes that require patience and discipline, ensuring that trading decisions are based on reliable signals rather than impulsive reactions.
- Noteworthy: False breakouts or breakdowns are common occurrences in trading, emphasizing the importance of confirmation and validation before executing trades.
Risk Management

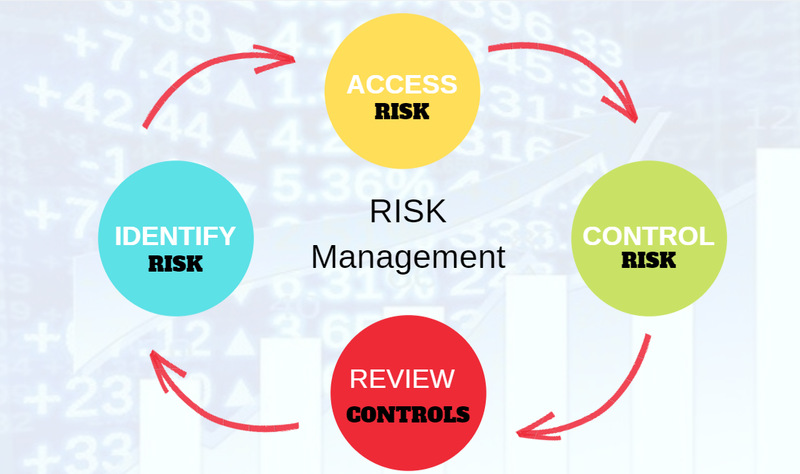
Managing risk is crucial to being a successful trader, and this applies even more when you are dealing with stock chart patterns. Make sure to set up specific entry and exit points according to your risk acceptance level and trading method. Using stop-loss orders along with position sizing techniques can assist in reducing possible losses while keeping capital intact during times of market volatility. By prioritizing risk management, traders can safeguard their investments and optimize long-term profitability.
The ways of managing risk should be personalized according to each person's style and profile in trading, thinking about things like account size, how often they trade, as well as the market's instability. More so, spreading risk by having diverse assets and different types of investment instruments can help lessen portfolio volatility while improving general returns that consider risks taken.
- Consideration: Adjust risk management parameters dynamically based on changing market conditions and portfolio performance to adapt to evolving risk profiles.
- Caution: Avoid over-leveraging positions or concentrating too much capital in high-risk trades, as this can amplify losses and jeopardize long-term financial goals.
Conclusion
In conclusion, being skilled in seeing significant stock chart patterns is very important for trading well in the finance markets. When you know about trends, notice usual patterns, use technical signs, confirm signals, and manage risk; it gives traders an advantage over others and helps them make steady profits. Learning all the time and practicing are crucial for getting better at these abilities and adjusting to changes in market situations. By keeping focused and orderly, you can become skilled in recognizing and using stock chart patterns to reach your investment aims.
-
 Investment Oct 08, 2023
Everything About the Oil Price Forecast
The term "crude oil" refers to a specific type of petroleum, a liquid fossil fuel derived from underground hydrocarbon reserves and organic elements. This commodity's price tag is quoted in U.S. dollars. Most oil comes from Saudi Arabia, Russia, the United States, Iran, and China. Oil consumption is highest in the United States, China, Japan, and Russia.
-
 Know-how May 16, 2024
Unveiling Ancillary Benefits: Beyond the Basics of Employee Perks
Explore the impact of ancillary benefits on workplace culture, employee satisfaction, and retention, highlighting how companies can stand out in the job market.
-
 Know-how Sep 19, 2024
Barchart Premier Review: Lots of Features, But Is It Worth It?
Barchart Premier offers extensive data, user-friendly tools, and resources for active traders and serious investors to enhance their investment strategies.
-
 Taxes Jan 07, 2024
Form 1095-C: Definition, Uses, and Tax Filing Requirements Explained
Understand what Form 1095-C is, its uses and tax filing requirements. Our guide provides a comprehensive overview to assist you during tax season.
